Measuring The Value of Your Site Content
This week we’re looking tracking your online marketing. We started with a look at what your marketing dashboard should look like, then showed how to track online marketing effectiveness in Google Analytics.
Today, we’re going to take a quick look at how to use one of my favorite Google Analytics features: $index (pronounced “dollar index”). Simply, $index looks at pages that contributed to conversions during a given session (you can see a full definition here).
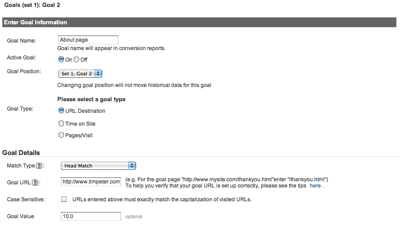
To use $index, define a conversion value for each of your goals in the “Goal Settings” section of Google Analytics:

Ideally, e-commerce sites will calculate the $index using the e-commerce tracking code. But I like to set a value for every goal on a site, even if there’s no absolute value. For instance, if the primary goal on a site is worth $100 to the business, I can then use that as a baseline and estimate the value of other goals. A goal that’s worth roughly 20% of the primary goal gets assigned a $20 value, one that’s worth 5% gets a $5 value, and so on. Even non-commerce sites can use this technique. Set your primary goal as worth $100 and, as just mentioned, calculate your other goals’ values as a percentage of that number.
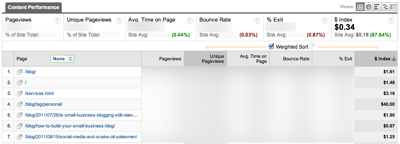
Once you’ve established your goal value, you can measure the value of each page on your site by its $index. For instance, here are pages on this blog sorted (with a weighted sort) on $index (the goal value for this profile’s goal is $10):

I can clearly see that people who visit my blog’s home page convert at 16.1% ($1.61 divided by the goal value of $10), those who visit my website home page convert at 14.8%, and those who visit my company’s services page convert at 31.6%. Pretty useful, huh?
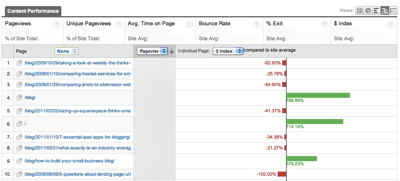
Where this really comes in handy is when deciding which site elements to fix. If you’ve got a page that gets loads of visits but has a low $index relative to your site average, that’s a great place to start improving your website. For example, here are pages on this blog, sorted by page views, using a comparison view of $index:

Clearly, those top 3 pages (and 7 out of the 10 shown) trail the average on $index and offer plenty of opportunity to improve site performance. Now just imagine what you could do on your site with this kind of information. Need help with any of this? Drop me a line. I’m happy to help if I can.
Are you getting enough value out of your small business website? Want to make sure your business makes the most of the local, mobile, social web? thinks helps you understand how to grow your business via the web, every day. Get more than just news. Get understanding. Add thinks to your feed reader today.
And while you’re at it, don’t forget to follow Tim on Twitter.
Tim Peter & Associates helps companies from startups to the Fortune 500 use the web to reach more customers, more effectively every day. Take a look and see how we can help you.
Technorati Tags: analytics, continuous improvement, conversion, conversion rate, conversion rate optimization, Data-Driven Marketing, E-commerce, e-commerce, E-commerce strategy, e-marketing, ecommerce, goal setting, goals, Google Analytics, how to measure anything, internet business, internet marketing, landing page optimization, marketing best practices, measurement, metrics, objectives, online marketing, page design, performance, solutions, tools
This Post Has One Comment
Leave a Reply
You must be logged in to post a comment.

[…] Analytics. My favorite: Page Value — or, as Phil calls it, “the triumphant return of $ index!” (though the comments on LunaMetrics’ blog seem to indicate that it’s vanishing […]