Measuring Traffic: Web Analytics Fundamentals
When I’m looking at a site for the first time, the first thing I want to get a sense of is its traffic. Traffic is the lifeblood of any website and, while there is such a thing as “bad” traffic, the fastest way to gauge the health of a site is to look at its traffic in some detail.
So, how do you do this?
First, I always like to start at a 10,000-foot level, then work my way down. Remembering the 7 keys to successful web metrics, I like to look at the total traffic the site receives, by month and by week, for the longest practical period that:
- Mirrors the business reality, and
- Data exists for.
What do I mean by “longest practical period that mirrors the business reality”?
Actually, it’s pretty simple. Some businesses, like retail and hospitality, are highly seasonal. Looking at traffic for, say, just the last few weeks doesn’t show me the “shape” of customer demand. For these types of business, I want to look at at least a year’s worth of data, though 13-15 months is usually better (remember, this is just for the initial, 10,000-foot level; we’re not drilling into details here).
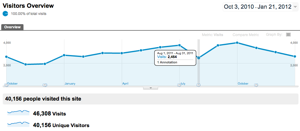
Here’s what that looks like in Google Analytics:

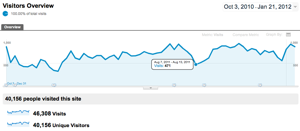
And here’s the same data by week:

This particular site shows a dip in traffic during the month of August (as seen on the “by month” graph), with a significant drop during a three-week period (seen on the “by week” graph). Even without drilling into this too far, we can see a rough climb throughout the year tailing off in December, but also flag a potential trouble spot during that particular August.
At this point, I would normally just note the issue for follow up with the business owner later. I might also increase the period I’m looking at, but, in this case, the site didn’t have analytics installed prior to October of 2010 (that’s what I mean by “data is available for’). While the business team might know why there was a dip in August—for example, seasonality, severe weather or server crash—we may have to settle and see if the trend holds in 2012.
In any case, a picture of customer behavior starts emerging. The business starts attracting customers to its site in January, trends upwards until late summer, recovers through Halloween, then starts to decline through the holidays. Mind you, this isn’t sophisticated analysis (remember, we’re calling this series “Web Analytics Fundamentals”), but you can already put together some insights about the business. Even better, if you’ve got sales data available, you can overlay the two to form a more robust view of the business.
Now, note during this part of the analysis, I’m not worrying about whether I’m looking at visits or unique visitors. Each has its merits. Unique visitors usually work better for calculating your actual conversion rate, while the number of visits shows you total opportunity because of “the first conversion” effect (i.e., people who return to your site buy at higher rates than those visiting the first time). I’m just looking at “traffic,” i.e., how much attention the site gets from potential customers. I prefer visits for my first pass, but I pay careful attention to the ratio of visits and unique visitors as I drill down, too.
Once I’ve got a feel for the traffic pattern of the site, that’s when I drill down to the next level… but we’ll get to that next time. In the meantime, take a look at your web traffic and start to question whether it’s growing or not. If it is, great. We’ll look at what to do with that extra traffic later. And if not, don’t worry. We’ll look at how to identify any problems next week. Be sure to check out the whole series for more details.
Are you getting enough value out of your small business website? Want to make sure your business makes the most of the local, mobile, social web? thinks helps you understand how to grow your business via the web, every day. Get more than just news. Get understanding. Add thinks to your feed reader today.
And while you’re at it, don’t forget to follow Tim on Twitter.
Tim Peter & Associates helps companies from startups to the Fortune 500 use the web to reach more customers, more effectively every day. Take a look and see how we can help you.
Technorati Tags: analytics, Google Analytics, integrated marketing, internet marketing, marketing, marketing best practices, measurement, metrics, Omniture SiteCatalyst, online marketing, Webtrends
Comments (0)
Leave a Reply
You must be logged in to post a comment.

[…] time, we took a look at measuring website traffic. Today, we’re going to look at where that traffic comes […]