Tracking Conversion: Web Analytics Fundamentals
I’ve covered conversion rate in a competitive context in the past, but today I want to look at conversion on your site in more detail.
First, whenever you’re talking about conversion rate, you need to talk about what defines “conversion” for your business. As this series focuses solely on the most important metrics to determine how well your site and business perform, we’re only interested in conversion metrics that lead directly to—or themselves represent—meaningful business results.
Here are some examples from clients I’ve worked with:
- Hotels: Reservations
- Retail: Online sales
- Restaurants: Reservations
- Loyalty programs: Account sign-ups
- Financial services: Accounts opened
- Training services: Courses enrolled, courses completed
- Franchisors: Leads
- Wholesalers: Orders
- Real estate: Leads
Configuring your specific analytics tool to track conversions is outside the scope of this post, other than to say it usually entails placing a “tag” (a small piece of Javascript code) on each web page in the transaction path. Sometimes IT requirements make that a little more onerous than it sounds. But, to be fair, your CEO usually holds those IT folks accountable for ensuring that transaction path stays up and running 24/7/365, so work with them. You’re all on the same team. If you need help getting your analytics configured, drop us a line.
In some cases, your existing shopping cart/booking engine/lead system/what-have-you won’t let you modify the analytics code to track conversions. In those cases, you can usually pass parameters through the transactions via a hidden field or some other such mechanism. Again, if you need help, contact me and let me know.
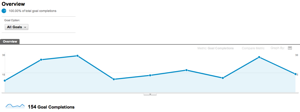
Once you’re tracking meaningful conversions, it’s usually easy to pull a report that shows you how many you’ve received over a given period. For instance, this is what it looks like in Google Analytics (we’re looking at a nine-week period):
As ever, we’re looking for anomalies, which makes that dip in the middle (around week 4)—or the spikes surrounding it—curious.
And this is where the segmentation we looked at yesterday offers so much value.
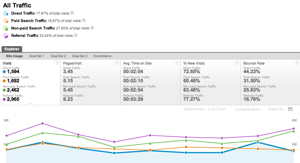
Our traffic segment report shows that we had a drop in referral and natural search traffic beginning in week 4 when sales dropped off:
Now, wouldn’t it be great if you could view your conversions the same way?
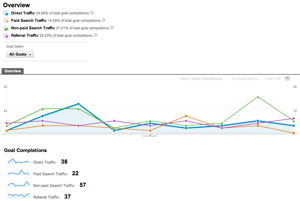
Actually, you can. Most tools allow for segmenting conversions the same as traffic (in particular, this is an area where Google Analytics really shines):
It’s clear by looking at the data that organic search and direct traffic provided the bulk of the conversions prior to week 4, but only organic search picked up again in week 8. As with the discussion yesterday, this level of data offers both insights and opportunities for improvement. Did the company end any off-site or other offline marketing during the same period as the decline? Did they change their email marketing pattern? Could we use paid media to offset the decline in direct conversions? Again, we’re looking for anomalies and using those to drive business decisions.
Another point worth mentioning is how segmentation aids our understanding of what’s going on with the site. Without segmentation, we see that there were roughly 8,700 visits and 154 transactions resulting in a 1.77% “conversion” rate. But, in reality, this is what conversion actually looked like:
| Source | Conversions | Visits | Conversion Rate |
|---|---|---|---|
| Direct | 38 | 1,594 | 2.38% |
| Organic search | 57 | 2,462 | 2.32% |
| Paid search | 22 | 1,692 | 1.30% |
| Referred | 37 | 2,965 | 1.25% |
Armed with this data, we’re immediately able to create action plans around each of these areas to drive increased traffic, increased sales, or both. It’s important to note that looking at data at this level also ignores multi-channel attribution.
But, the point isn’t to answer every question. It’s to get enough information to start making positive business decisions. Notice how quickly we’re able to make some decisions once we’ve got some trended, segmented traffic and sales data. In the spirit of fairness, I’ll take a look tomorrow at some of the nuances of conversion data worth thinking about. In the meantime, check out the rest of the Web Analytics Fundamentals series and start digging into your data. I guarantee that with only this level of information you can start making some seriously positive changes in your online marketing and e-commerce efforts.
Are you getting enough value out of your small business website? Want to make sure your business makes the most of the local, mobile, social web? thinks helps you understand how to grow your business via the web, every day. Get more than just news. Get understanding. Add thinks to your feed reader today.
And while you’re at it, don’t forget to follow Tim on Twitter.
Tim Peter & Associates helps companies from startups to the Fortune 500 use the web to reach more customers, more effectively every day. Take a look and see how we can help you.
Technorati Tags: analytics, attribution, attribution modeling, Avinash Kaushik, conversion, conversion rate, conversion rate optimization, E-commerce, e-commerce, Google Analytics, how to measure anything, integrated marketing, internet business, internet marketing, marketing, marketing best practices, measurement, metrics, Omniture SiteCatalyst, online marketing, performance, ppc, search, search engine marketing, search engine optimization, sem, seo, Webtrends


[…] Previous post: Tracking Conversion: Web Analytics Fundamentals […]
[…] need more background on what conversions and conversion rate are, check out our past coverage of conversion tracking fundamentals). In this post, I walk you through three tips can help you improve your conversion rate and lower […]